Crypto Fear & Greed Index: How Beginners Can Use It

Understanding the Crypto Fear & Greed Index: A Guide to Market Sentiment
The cryptocurrency market is renowned for its dramatic price swings, often driven as much by human emotion as by fundamental value. Understanding the collective mood or sentiment of the market – whether participants are predominantly fearful or overly greedy – can provide valuable context for navigating this Crypto Volatility. The Crypto Fear & Greed Index is a popular tool designed specifically to measure this emotional pulse of the market. This guide explains how the index works, why sentiment matters, and how you can use this tool as part of your decision-making process.
What is the Crypto Fear & Greed Index?
The Crypto Fear & Greed Index is a market sentiment analysis tool that attempts to quantify the prevailing emotions driving the cryptocurrency market. It synthesizes various data points into a single number, typically ranging from 0 to 100, indicating whether the market sentiment leans towards fear or greed.
- Low Score (0-49): Indicates FEAR. Investors are generally pessimistic, worried about price drops, and potentially selling. Extreme fear (often 0-25) suggests panic may be setting in.
- Mid Score (~50): Indicates NEUTRAL. The market sentiment is relatively balanced, without strong fear or greed dominating.
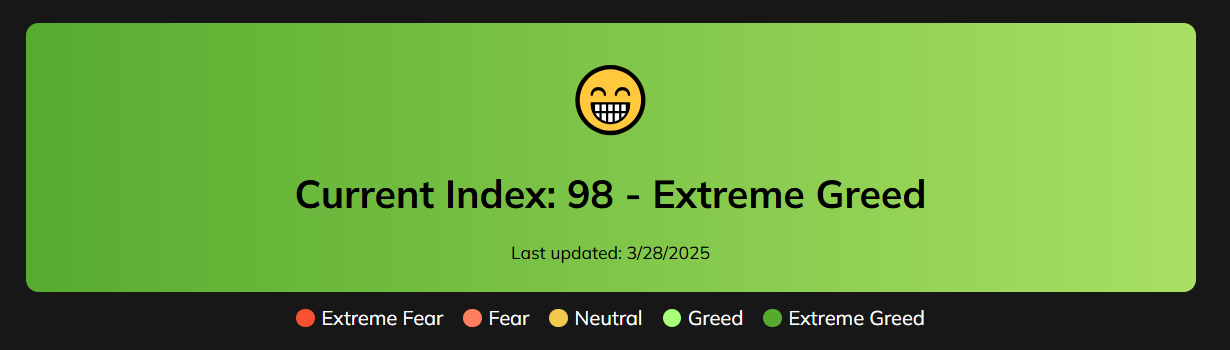
- High Score (51-100): Indicates GREED. Investors are optimistic, expecting prices to rise, and potentially buying enthusiastically. Extreme greed (often 75-100) suggests euphoria and potentially over-optimism.
You can view the current sentiment reading on our dedicated tool page: Crypto Fear & Greed Index.
Index Levels at a Glance:
| Index Range | Sentiment | Emoji |
|---|---|---|
| 0 - 24 | Extreme Fear | 😱 |
| 25 - 49 | Fear | 😢 |
| 50 | Neutral | 😐 |
| 51 - 74 | Greed | 🙂 |
| 75 - 100 | Extreme Greed | 😁 |
How is the Index Calculated? Key Components
The index aggregates data from multiple sources, each weighted to contribute to the final score. While the exact formula may vary slightly between providers (like Alternative.me, the original source), the common inputs typically include:
- Volatility (e.g., ~25% weight): Measures the current price volatility of Bitcoin compared to its recent historical averages (e.g., 30 and 90 days). Unusually high volatility often correlates with a fearful market.
- Market Momentum & Volume (e.g., ~25% weight): Compares current trading volumes and buying momentum against historical averages. Strong upward momentum and high buying volume usually indicate greed.
- Social Media Sentiment (e.g., ~15% weight): Analyzes the volume and tone of crypto-related posts, hashtags, and discussions on platforms like Twitter (X) and potentially others, looking for unusually high interaction rates or extremely positive/negative sentiment.
- Bitcoin Dominance (e.g., ~10% weight): Tracks Bitcoin's market share relative to Altcoins. A rise in Bitcoin dominance can sometimes suggest a "flight to safety" (fear), as investors move capital from riskier altcoins to Bitcoin. Conversely, falling dominance during an "alt-season" can indicate higher risk appetite (greed).
- Search Trends (e.g., ~10% weight): Analyzes data from sources like Google Trends for specific crypto-related search queries. Spikes in searches like "Bitcoin price manipulation" might indicate fear, while surges in "How to buy crypto" could signal growing greed or interest.
- Surveys (Historically ~15% weight - Status Variable): Traditionally, weekly polls gauged investor sentiment directly. However, the use and availability of reliable large-scale surveys can vary, and some index providers may currently pause or modify this component.
Why Market Sentiment Matters: The Psychology of Cycles
Financial markets, especially speculative ones like crypto, are heavily influenced by human psychology. Emotions often drive buying and selling decisions, leading to cyclical patterns:
- The Cycle: Markets tend to oscillate between periods of fear, leading to selling and lower prices, and periods of greed, leading to buying and higher prices. These cycles often overshoot rational valuations due to herd behavior. Extreme fear can lead to capitulation (panic selling near bottoms), while extreme greed can fuel unsustainable bubbles (euphoric buying near tops).
- Contrarian Opportunities: Understanding market sentiment allows for potential contrarian thinking, famously summarized by Warren Buffett: "Be fearful when others are greedy, and greedy when others are fearful." The index aims to identify these extremes. When the index signals extreme fear, it might suggest assets are oversold and potentially undervalued, presenting a buying opportunity for those with a long-term view. Conversely, extreme greed might indicate a market is overheated and due for a correction, suggesting caution or potential profit-taking.
- Market Dynamics: Extreme sentiment can become self-reinforcing for a time. Widespread FOMO (Fear Of Missing Out) during greedy phases pulls in more buyers, pushing prices higher. Widespread panic during fearful phases triggers more selling, pushing prices lower. Large market participants ("whales") may also observe these sentiment extremes and position themselves accordingly, potentially amplifying moves.

Interpreting the Index Levels: A Beginner's Guide
- Extreme Fear (0-24): Indicates widespread panic and pessimism. Investors may be indiscriminately selling. For contrarians, this could signal that the market is oversold and potentially near a bottom – a time for careful research into buying opportunities if fundamentals align.
- Fear (25-49): Shows general worry and cautiousness. Prices may be declining or stagnant. Could still be a potential accumulation zone for long-term investors using strategies like Dollar-Cost Averaging (DCA).
- Neutral (50): Suggests market indecision. Neither strong fear nor greed prevails. Often a period of consolidation before the next significant move.
- Greed (51-74): Indicates growing optimism and investor confidence. Prices are likely rising, and FOMO may start building. A time to be increasingly cautious and stick to your plan.
- Extreme Greed (75-100): Signifies market euphoria. Investors may be acting irrationally, chasing high returns. Often warns that the market is overbought and could be due for a correction. For contrarians, this might signal a time to consider taking profits or reducing exposure.
How to Use the Fear & Greed Index Effectively
This index is a tool, not a crystal ball. Use it wisely:
- Combine with Other Analysis: Never rely solely on the Fear & Greed Index. It reflects sentiment, not fundamental value or technical price structure. Use it alongside your own Do Your Own Research (DYOR), technical analysis (chart patterns, support/resistance levels), and on-chain data.
- Use as a Contrarian Indicator (with Caution): Consider extreme readings as potential signals to think against the crowd. Investigate why the market is fearful or greedy before acting. Extreme fear during a fundamentally sound project's dip might be an opportunity; extreme greed for a hyped meme coin might be a major warning sign.
- Gauge Your Own Emotions: Use the index as a mirror. If you feel intense FOMO when the index shows Extreme Greed, recognize this bias. If you feel panicked when the index shows Extreme Fear, step back and reassess your long-term strategy rationally.
- Integrate into Your Strategy: Don't let the index dictate your actions, but use it to inform them. For example, you might decide to slightly increase your DCA buys during periods of Extreme Fear or scale out of positions gradually as the index enters Extreme Greed, according to your pre-set plan.

Historical Context: Sentiment Extremes and Market Turns
Looking back at historical market events provides context (without relying on specific dates):
- Major Bear Markets: Periods of prolonged market downturns often feature extended readings in the "Fear" and "Extreme Fear" zones. These phases have historically presented accumulation opportunities for long-term investors who bought quality assets when sentiment was lowest.
- Significant Bull Runs: Major bull market peaks have frequently coincided with sustained periods of "Extreme Greed," often serving as a warning sign that a market correction was becoming increasingly likely. Investors who took profits during these euphoric phases were better positioned for subsequent downturns.
- "Black Swan" Events: Sudden, unexpected negative events (like major exchange collapses or regulatory crackdowns) typically cause the index to plunge into "Extreme Fear" rapidly. These moments of maximum pessimism have sometimes marked generational buying opportunities, although catching the exact bottom is nearly impossible.
Limitations of the Fear & Greed Index
Be aware of the index's limitations:
- Lagging/Coincident: It reflects current or very recent sentiment, not necessarily predicting future moves accurately.
- Can Remain Extreme: The market can stay fearful or greedy for extended periods; an extreme reading doesn't guarantee an immediate reversal.
- Data & Weighting: The index relies on specific data inputs and weightings, which could potentially be skewed or changed by the provider.
- Doesn't Measure Fundamentals: High greed doesn't mean a project is bad, and high fear doesn't mean it's good – it only reflects collective emotion.
- Noise: Short-term news or events can cause temporary spikes or dips in the index without signaling a major trend change.
Conclusion: A Tool for Emotional Awareness
The Crypto Fear & Greed Index is a valuable addition to any crypto participant's toolkit, offering a simple yet insightful glimpse into the collective psychology driving the market. By understanding how it's calculated and interpreting its readings within a broader analytical framework, you can gain perspective on market extremes, potentially identify contrarian opportunities, and better manage your own emotional responses to volatility. Remember, it should complement, not replace, thorough research and a well-defined investment strategy. Use it as a guide to market mood, check it regularly on our Fear & Greed Index tool, but always make decisions based on a comprehensive assessment of all available information.